The Quantitative Scout: NBA Asset Valuation
Mission: Operationalizing High-Dimensional Data
This project serves as the frontend "Control Plane" for a new machine learning initiative. Our goal is to move beyond basic box-score stats and visualize the "hidden value" of NBA assets. We are building a system that doesn't just look at past performance, but predicts future efficiency by analyzing player archetypes.
The journey began with a question: Can we mathematically prove which players are undervalued?
1. The Spark: Clustering & Network Analysis
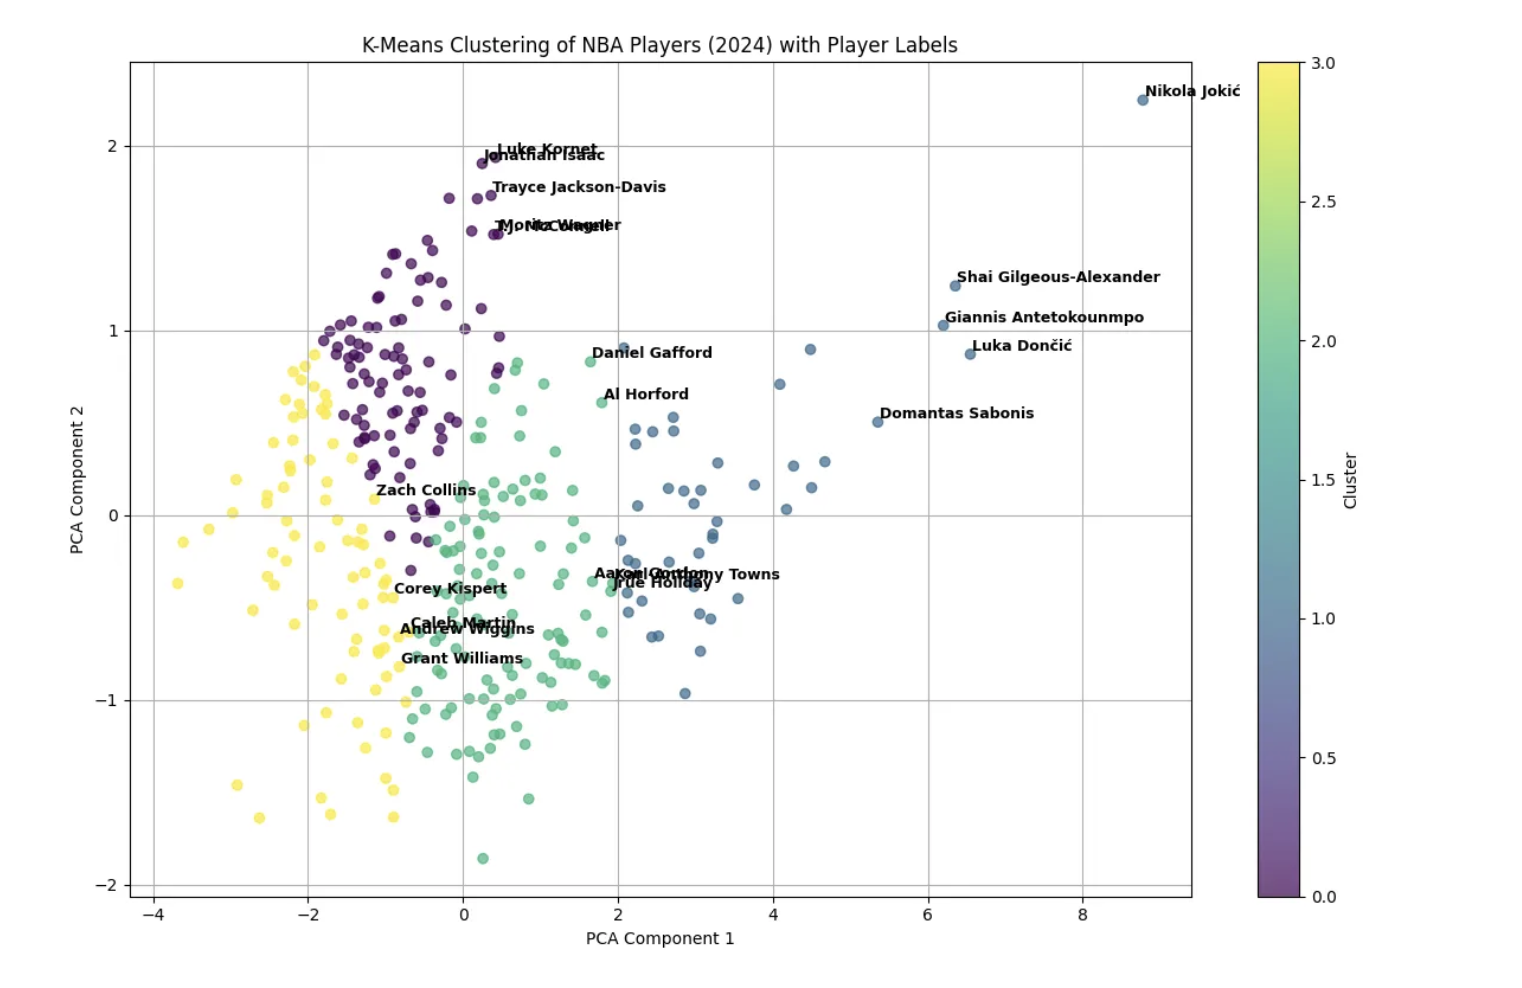
Our research framework was inspired by the work of data scientists who utilized K-Means Clustering and Principal Component Analysis (PCA) to regroup NBA players. Instead of "Point Guard" or "Center," they found mathematical clusters like "Floor General" or "Rim Protector."
The Insight: The Medium article demonstrated that by grouping players by behavior rather than position, we can find hidden market inefficiencies. This is the foundation of our "Asset Valuation" engine.
2. The Investigation: Data Source Selection
To build a robust model, we needed raw play-by-play data, not just summary statistics. We evaluated two primary datasets hosted on Kaggle to determine which offered the best "Signal-to-Noise" ratio for historical analysis.
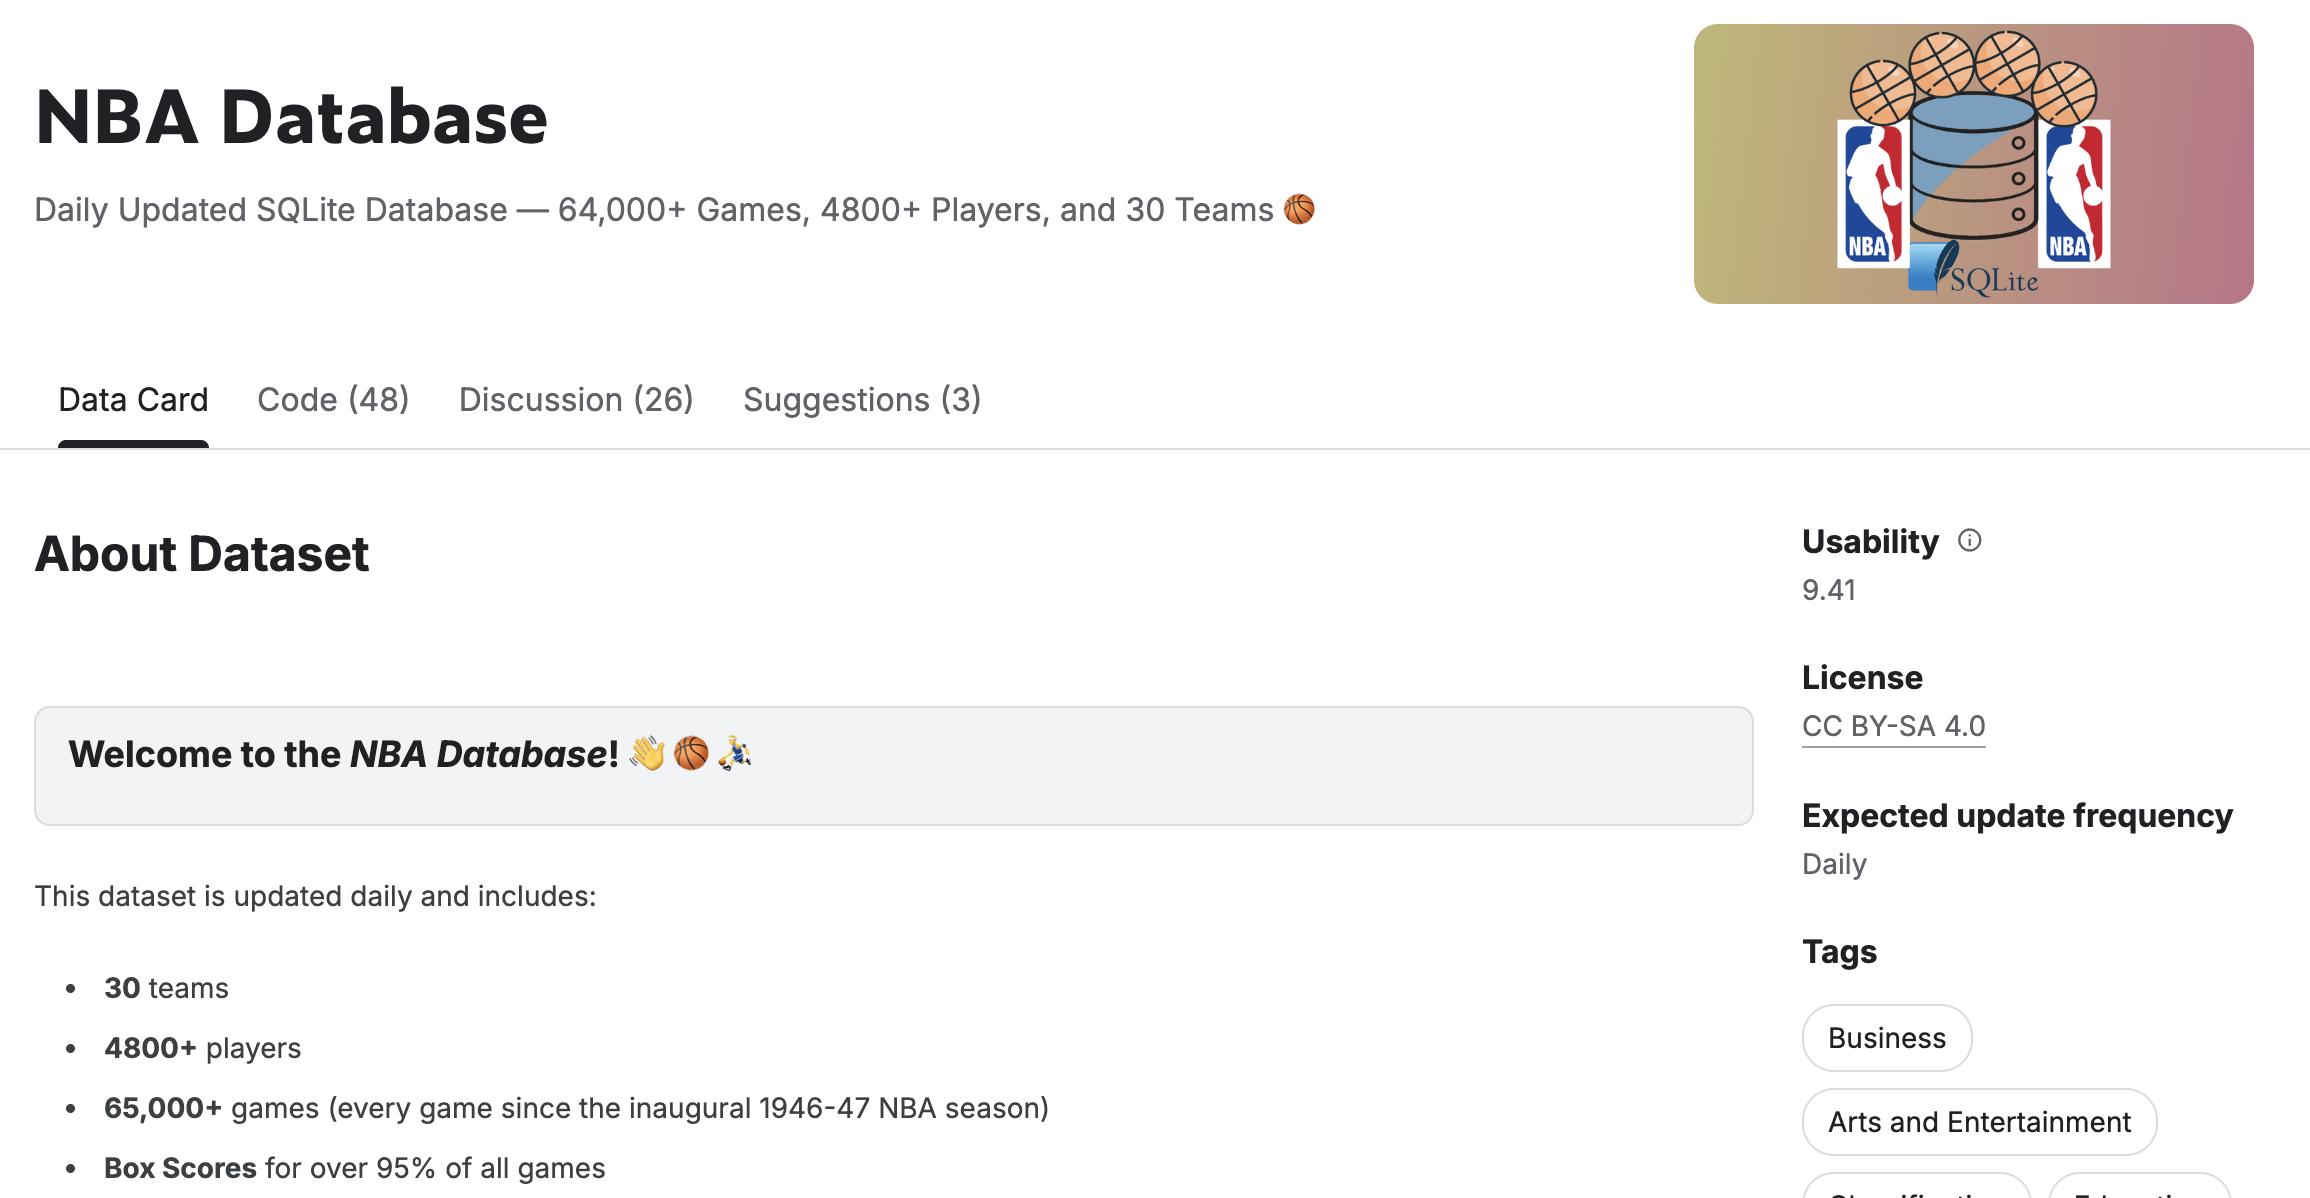
The "Control" Group (Wyatt Walsh): This is the most popular dataset in the community. It offers excellent modern data and API accessibility. However, for our "Moneyball" thesis, we needed deeper historical context to train our model on different eras of play.
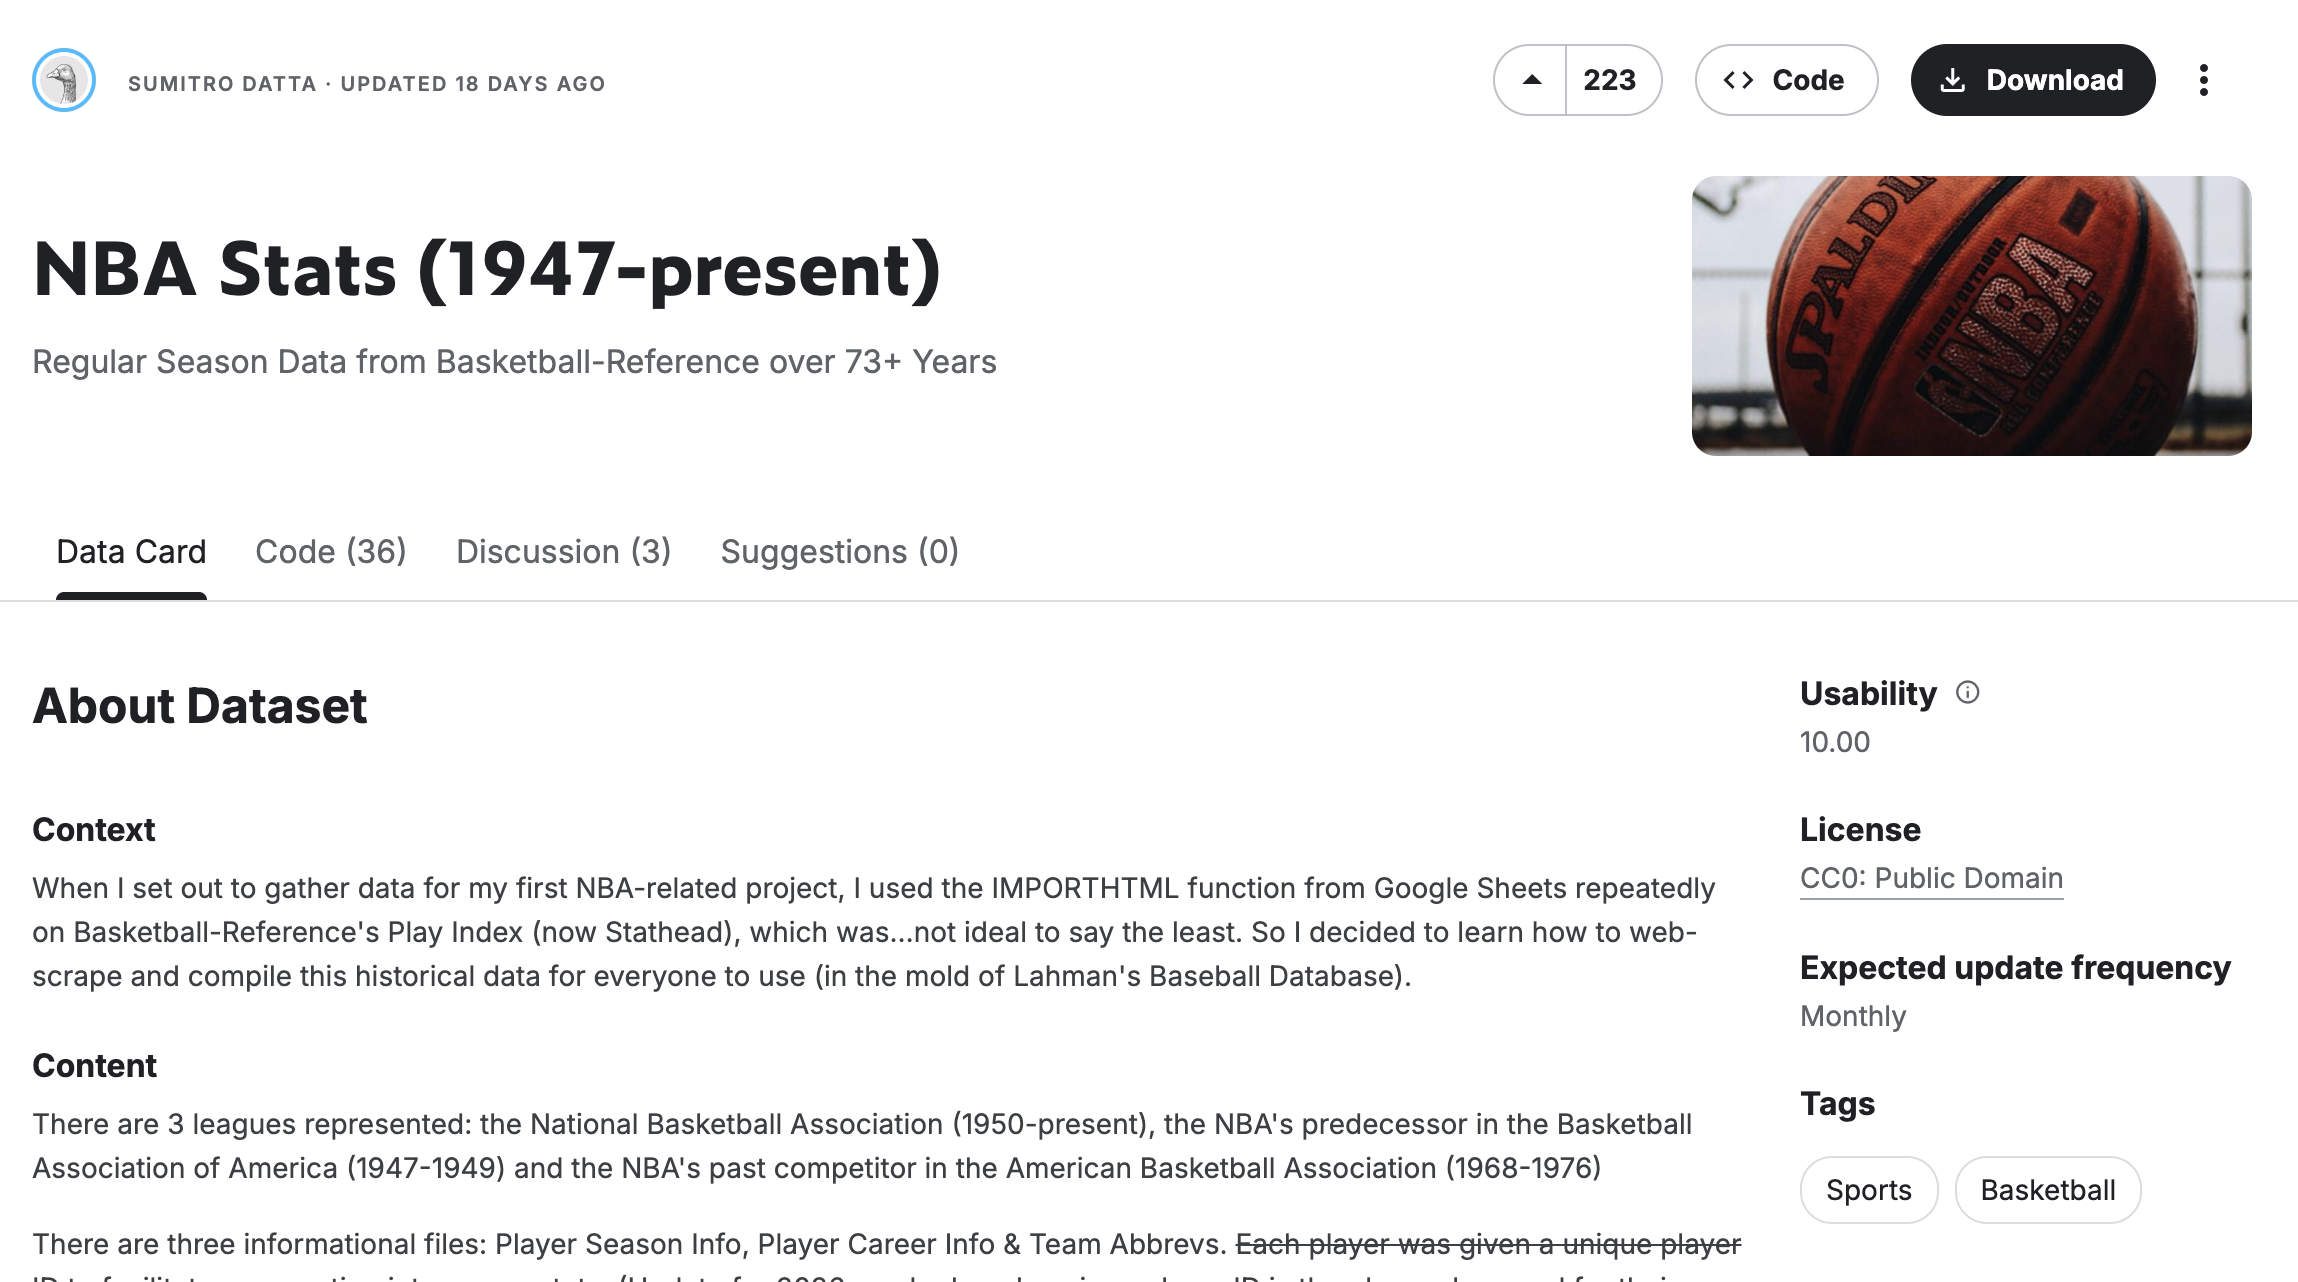
The "Variable" Group (Sumitro Datta): We pivoted to this dataset because of its granular CSV structure covering the NBA since 1947.
The Decision: We selected the Sumitro Datta dataset. Its file structure allows us to isolate specific "Eras" (e.g., The 3-Point Era) and train our Machine Learning models on context-specific data, rather than averaging stats across incompatible time periods.
3. The Theoretical Protocol: Triangulating Value
Rather than relying on a single data source, our valuation theory relies on "Triangulation." We cross-reference three distinct signals—Historical Value, Biometric Potential, and Shooting Mechanics—to filter out noise and identify true efficiency.
Signal 1: Historical Valuation
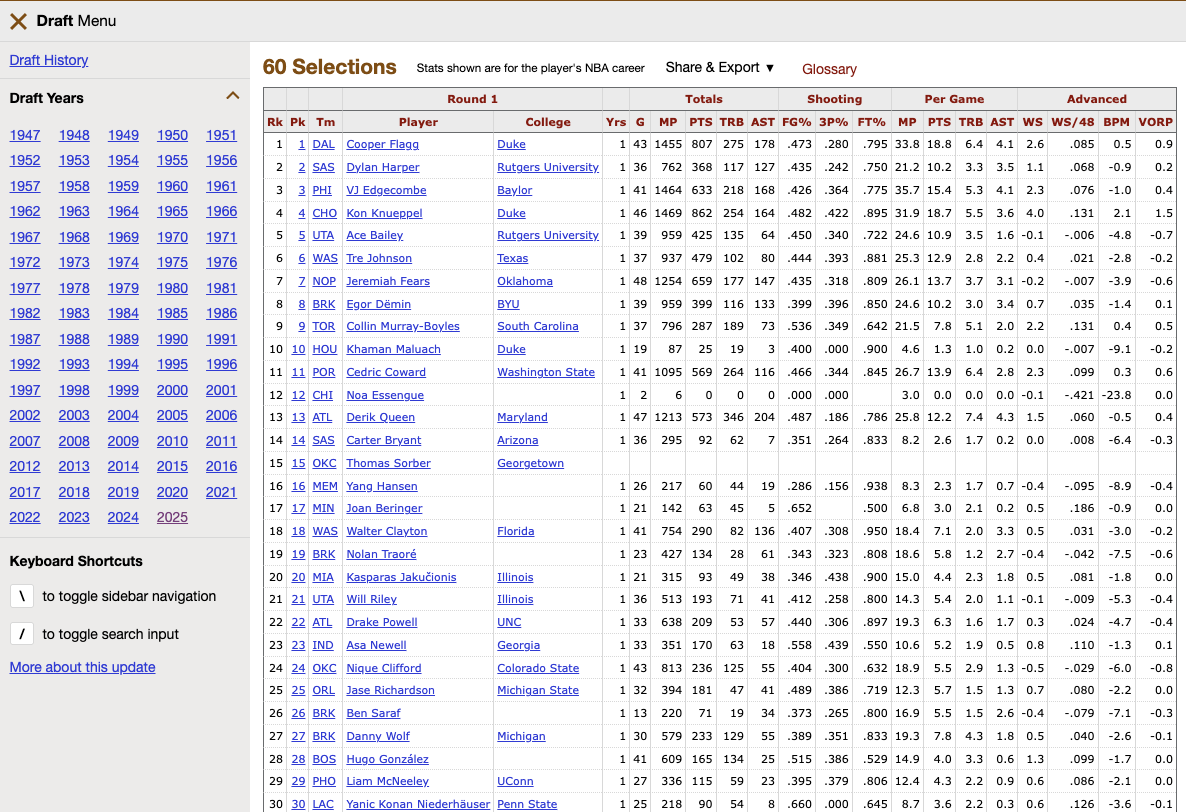
We begin with Basketball-Reference to establish a baseline. By analyzing the "Value Over Replacement Player" (VORP) of past draft classes, we can mathematically determine the "Bust Rate" of specific draft slots. This provides the "Base Rate" probability for our model.
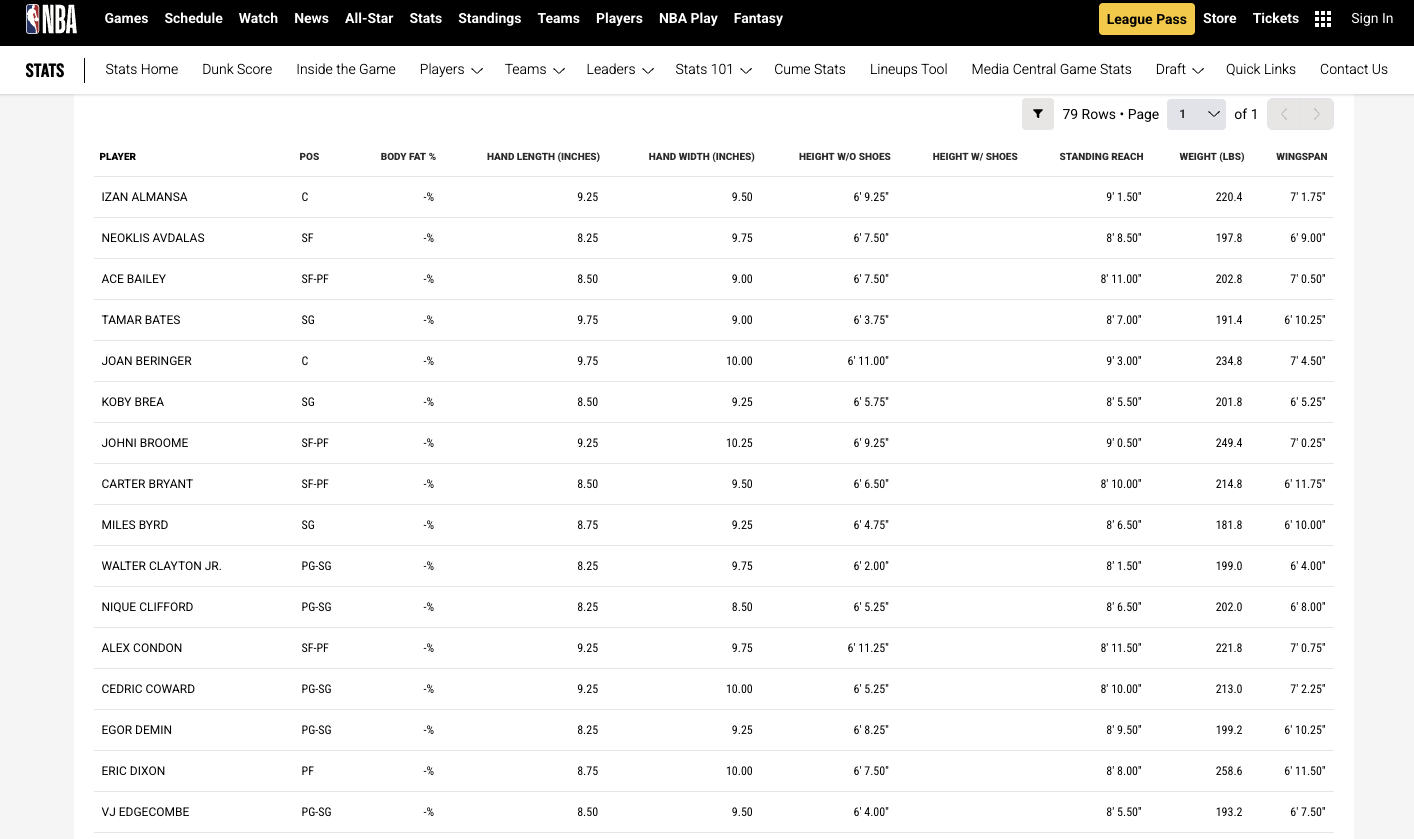
Signal 2: Biometric "Hardware"
Next, we inspect the physical "container" of the player using NBA.com/Stats. We look for the "Ape Index" (Wingspan > Height). Our theory posits that defensive versatility is a function of length, not just height. This dataset allows us to flag players with "Elite Physical Tools" regardless of their college stats.
Signal 3: Mechanical "Software"
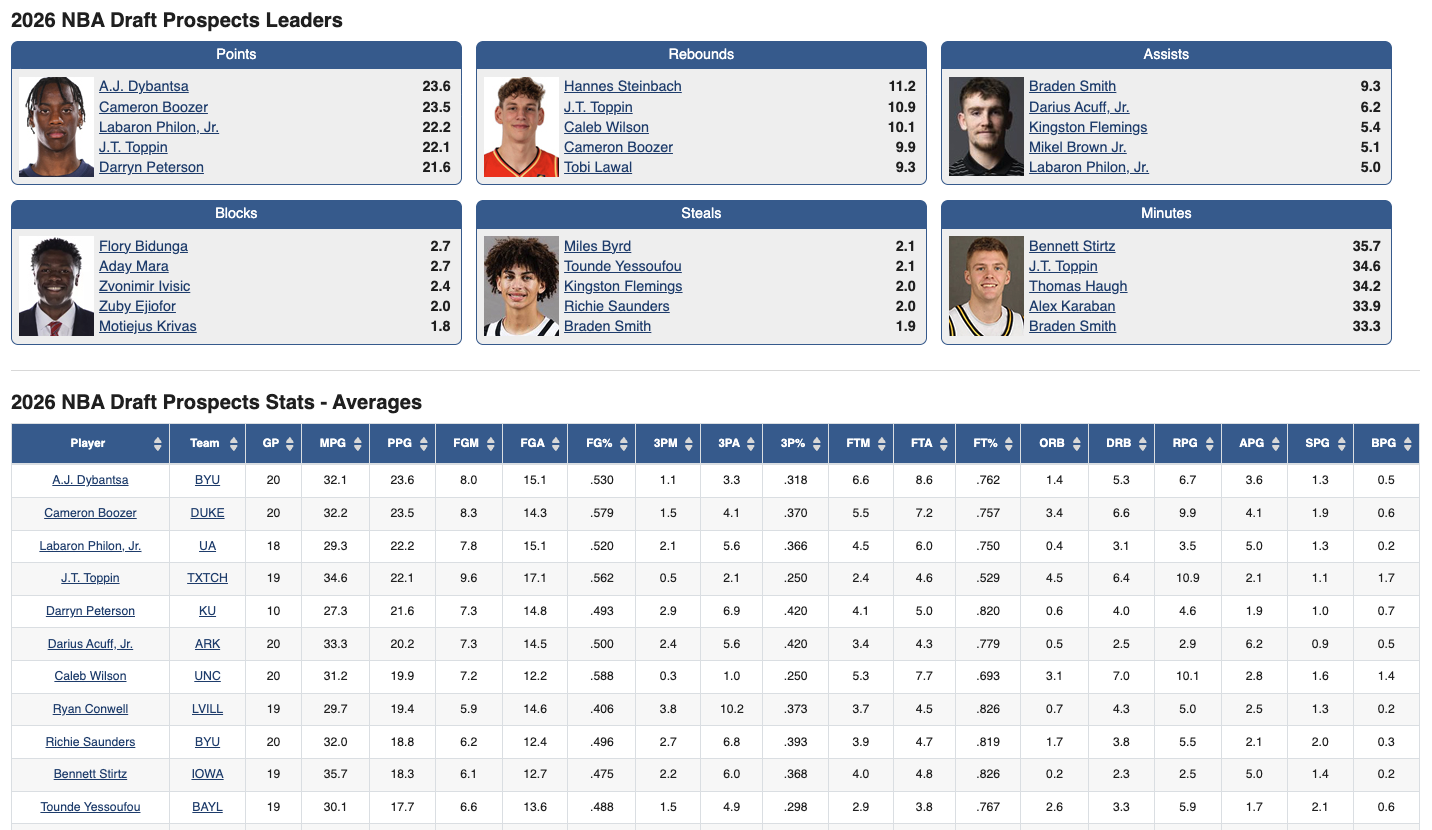
Finally, we use RealGM to assess skill transferability. We specifically isolate Free Throw Percentage (FT%) as a proxy for "Shooting Mechanics."
The Synthesis: By overlaying these three disparate data sources, we aim to calculate a "Sustainable Efficiency Score" that predicts how a player's game will translate to the professional level.
Workflow Disclosure & AI Attribution:
This project was executed using a "Human-in-the-Loop" generative workflow.
1. Deep Research: Manual evaluation of the Medium article on K-Means Clustering and the Kaggle datasets (Walsh vs. Datta) established the ground truth.
2. Strategic Synthesis: Gemini was utilized to condense the "Quantitative Scout" research report into the web copy presented above, aligning the three data sources (Basketball Reference, NBA.com, RealGM) into a cohesive valuation theory.
3. Development: The HTML structure was scaffolded by AI, then manually refined in VS Code to meet specific design constraints.
IDSN 530 / Spring 2026